Customer Churn Prediction in 2026: The AI-Powered Guide for Marketing Teams to Save At-Risk Accounts
Acquisition costs are climbing, competition is loud, and the buyers you already have are quietly choosing whether to stay or leave. In 2026, the smartest marketing teams stopped trying to out-spend churn and started predicting it. This guide shows you how customer churn prediction works, which AI models actually move the needle, and how to turn early warning signals into automated save plays that protect revenue.
TL;DR
- Customer churn prediction uses machine learning to flag at-risk accounts weeks before they cancel, giving marketing time to intervene with personalized retention plays.
- Retail and SaaS teams using AI churn prediction see up to 2.9x revenue lift, and a 5% drop in churn can lift profits 25 to 95 percent.
- The 2026 stack: gradient boosting and ensemble models on first-party behavioral data, combined with intent signals and product usage telemetry.
- Marketing owns the save motion. Predictions only matter if they trigger automated nurture flows, ad suppression, lifecycle emails, and CSM alerts.
- MarqOps unifies the data, the model, and the activation layer so your churn prediction does not live in a spreadsheet nobody opens.
Table of Contents
- What is customer churn prediction
- Why 2026 is the year retention beats acquisition
- How AI churn prediction actually works
- The data inputs that drive accurate models
- Machine learning models for churn prediction
- A 6-step implementation playbook
- Marketing save plays that actually win accounts back
- KPIs and benchmarks for 2026
- Common mistakes to avoid
- How MarqOps unifies prediction and activation
- FAQs
What is customer churn prediction?
Customer churn prediction is the process of using historical data and machine learning to score every customer on their likelihood to cancel, downgrade, or stop engaging within a defined time window. It answers a brutally specific question: which accounts are quietly heading for the exit, and what would it take to turn them around?
The legacy version of this work was a quarterly retention review built from gut feel and stale CRM notes. The 2026 version is a continuously updated score that refreshes every time a customer logs in, opens an email, files a ticket, or skips a renewal touch. The output is not a report. It is a real-time signal that triggers downstream marketing, sales, and customer success actions automatically.
Predictive churn modeling sits at the intersection of predictive marketing analytics and operational marketing automation. Done well, it does not just tell you who is leaving. It tells you why, when, and what to do next.
Why 2026 is the year retention beats acquisition
Three forces converged this year that pushed churn prediction from a nice-to-have into an operational requirement.
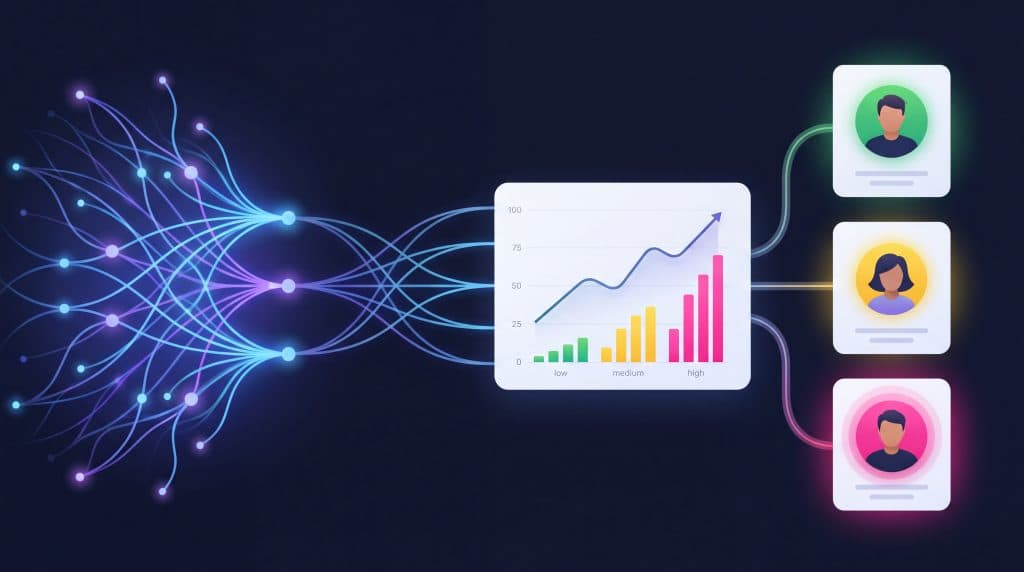
Revenue lift for teams using AI-powered churn prediction vs reactive retention
First, acquisition costs broke the math. Paid CAC has risen for seven consecutive quarters across most B2B and consumer categories, and the marketing leaders who are growing right now are doing it through expansion and retention rather than new logo volume.
Second, customer data finally caught up to the models. The average mid-market company runs more than 90 SaaS apps, and unified data layers built on first-party telemetry are now standard. There is enough signal in your stack today to train a churn model that actually works.
Third, AI moved out of the lab. Gradient boosting frameworks, ensemble methods, and explainable AI techniques like SHAP analysis are accessible to any marketing ops team with a competent analyst, no PhD required. The technology stopped being the constraint.
The numbers behind the urgency are loud. Reducing churn by just 5 percent can lift profits anywhere from 25 to 95 percent, depending on customer lifetime value. Existing customers are 50 percent more likely to try new products and spend 31 percent more than first-time buyers. And the median B2B SaaS company is sitting at 88 to 90 percent annual retention, while top performers are pushing net revenue retention past 120 percent. The gap between the median and the leader is where churn prediction lives.
Reality check: Marketing teams that still treat retention as a customer success problem are leaving real money on the table. Retention is a marketing problem the moment a renewal lands in your pipeline.
How AI churn prediction actually works
The mechanics are less mysterious than the vendor pitches make them sound. A churn prediction system does four things on a loop.
1. Ingest. It pulls behavioral, transactional, demographic, and engagement data from across your stack. This includes product usage logs, email and ad engagement, support tickets, NPS responses, billing events, and CRM activity. The richer the inputs, the sharper the model.
2. Engineer features. Raw data gets transformed into features the model can learn from. Examples include “days since last login,” “support tickets opened in past 30 days,” “feature usage trend over 90 days,” and “time spent in pricing page in the last week.” This step is where domain expertise matters most.
3. Train and score. A machine learning algorithm is trained on historical data, comparing customers who churned against those who stayed. The trained model then produces a probability score, usually between 0 and 1, for every active customer. Most teams bucket those scores into low, medium, and high risk tiers.
4. Act. The scores flow into your activation systems. High risk accounts get added to retention nurture flows, flagged to CSMs, suppressed from new acquisition retargeting, and surfaced on marketing dashboards. This is the step that separates a model that works from a slide deck that does not.
By 2026, the leading systems do all four steps continuously. Scores update in near real time as new behavior arrives, which means a customer who suddenly stopped logging in last Tuesday is flagged before next Tuesday’s QBR.
The data inputs that drive accurate models
Most churn models fail not because the math is wrong but because the data is incomplete. The features below are the ones that consistently carry the most predictive weight across B2B and SaaS use cases.
Product usage signals. Login frequency, depth of feature adoption, time spent in core workflows, and trend deltas over rolling windows. Customers who used to log in five times a week and now log in once are sending the loudest signal in the system.
Engagement signals. Email opens and clicks, content downloads, webinar attendance, and ad interaction. Engagement decay is the canary in the coal mine for accounts that are mentally already gone.
Support and sentiment signals. Ticket volume, ticket severity, resolution time, NPS responses, and survey free-text sentiment. A spike in support tickets followed by silence is a high-probability churn pattern.
Billing and contract signals. Days until renewal, expansion or contraction history, failed payments, and pricing tier changes. Involuntary churn from failed payments alone accounts for up to 48 percent of total churn in many SaaS businesses, and dunning recovery captures 50 to 80 percent of that without any product change.
Firmographic and demographic signals. Industry, company size, role of the primary user, region, and how the customer was originally acquired. Acquisition channel often correlates strongly with long-term retention.
External intent signals. Third-party intent data showing the customer is researching competitors. This is one of the highest-leverage but least-used inputs in most marketing stacks.
If you already run AI customer segmentation, you already have most of the firmographic and behavioral features needed to bootstrap a churn model.
Machine learning models for churn prediction
You do not need deep learning. A 2025 study comparing models for churn and lead scoring tasks found that gradient boosting and random forest ensembles outperformed neural networks for the vast majority of business datasets, and they are dramatically easier to explain to a non-technical stakeholder.
Here are the models that work in production marketing environments today.
Logistic regression. The simplest option and a great starting point. It produces interpretable coefficients so you can see which features push a customer toward churn. Use it as a baseline and a sanity check.
Random Forest. An ensemble of decision trees that handles non-linear relationships and mixed data types well. Strong out of the box and forgiving of imperfect data.
Gradient Boosting Machines, including XGBoost and LightGBM. Currently the workhorse of production churn prediction. Consistently top-of-table on accuracy benchmarks and now widely supported in mainstream MarTech and CRM platforms.
Ensemble approaches with SHAP analysis. Combining multiple models and using SHAP values to explain which features drove a specific customer’s risk score. This is the 2026 best practice for teams that need both accuracy and explainability for stakeholder buy-in.
Practitioner tip: Start with logistic regression as your baseline, then graduate to XGBoost once you have at least 1,000 customer records with a clean churn label. Accuracy gains beyond that come from better features, not fancier models.
A 6-step implementation playbook
This is the version of the playbook that works for marketing-led teams without a full data science org behind them.
Step 1: Define churn precisely. Is it cancellation, downgrade, contraction, dormancy, or all of the above? Pick a single definition and a specific time horizon, like “any customer who reduces spend by more than 25 percent within 90 days.” A fuzzy definition produces a fuzzy model.
Step 2: Unify your data. Centralize product, CRM, support, billing, and engagement data into one place. This is where most projects stall. A unified data layer or marketing operations platform like MarqOps removes the most expensive part of the work before it starts.
Step 3: Engineer features and build the training set. Pull at least 12 months of history, label every customer as churned or retained, and engineer the features outlined above. You need a minimum of around 200 churn events for a stable model, with 1,000+ being far better.
Step 4: Train, validate, calibrate. Train your model on 70 percent of the data, validate on 15 percent, and hold out the final 15 percent for a true out-of-sample test. Look at precision, recall, and AUC, and make sure your model is not just predicting the obvious churners.
Step 5: Operationalize the score. Push the daily score into your CRM, CDP, marketing automation platform, and dashboards. Define thresholds for low, medium, and high risk, and write the playbook for what happens at each tier.
Step 6: Close the loop. Track what happened to every account that hit “high risk.” Did the retention play work? What outreach moved the score back down? Feed those outcomes back into the next training cycle. Models that do not learn from their own predictions decay fast.
This pipeline is exactly the kind of cross-system process that benefits from AI workflow automation, where the score handoff, the alerting, and the nurture trigger all happen without human stitching.
Marketing save plays that actually win accounts back
The point of churn prediction is the intervention. Below are the save plays that consistently outperform generic “we miss you” emails. Match each play to the right risk tier and the dominant signal in the model.
The high-touch save. For high-value, high-risk accounts: a personal outreach from a senior CSM or AE, supported by a custom save offer and a tailored ROI report. Pair this with a suppression of all top-of-funnel marketing so the customer is not seeing your prospecting ads while you are trying to win them back.
The targeted re-engagement nurture. A short, focused email sequence built around the specific feature or value the account stopped using. Powered by AI personalization in marketing, every email pulls in the customer’s actual usage data and the gap the model identified.
The product nudge. An in-app message or push notification that recommends a specific next step based on what similar retained customers did at this stage. This converts well because it removes friction in the moment.
The expansion pivot. Some at-risk accounts churn not because they got less value but because they outgrew the current tier. A model that flags this pattern can trigger an upsell conversation instead of a discount.
The dunning rescue. For involuntary churn from failed payments, automated dunning with smart retry timing and updated card capture flows. This is the highest-ROI save play in the entire system because the customer was not even trying to leave.
The exit interview that becomes a save. When a cancellation request comes in, route it through a structured offboarding flow that asks why, presents a tailored counter-offer, and gives the option to pause instead of cancel. A surprising percentage of “cancellations” become pauses or downgrades when given the option.
KPIs and benchmarks for 2026
If you cannot measure the model, you cannot improve it. Track the following KPIs from day one.
Model accuracy metrics. Precision (when the model flags a churn risk, how often is it right), recall (of all customers who actually churned, how many did the model flag), AUC (overall ranking quality). Aim for AUC above 0.80 for a credible model in production.
Business outcome metrics. Churn rate by risk tier, save rate by play type, revenue retained per intervention, and net revenue retention. The model is working if your top-risk tier actually churns more than your low-risk tier, and if save rates in flagged accounts beat your baseline retention rate.
2026 benchmarks to compare against. The B2B SaaS median monthly churn sits at 3.5 percent, with top performers below 2 percent. Healthy annual churn is 10 to 15 percent. Net revenue retention medians are 106 to 110 percent, and top performers exceed 120 percent. Infrastructure SaaS has the lowest churn at around 1.8 percent. EdTech struggles at 9.6 percent.
You can layer churn prediction outputs directly onto your marketing dashboard alongside acquisition, pipeline, and revenue metrics so retention sits where the rest of the marketing org already looks.
Common mistakes to avoid
The same patterns sink most churn prediction projects. Watch for these.
Treating churn as a single event. Customers churn in stages: disengagement, contraction, downgrade, then full cancellation. A model that only predicts cancellation misses the first three opportunities to save the account.
Skipping the data foundation. Building a model on top of disconnected, unreliable data produces a confident-looking number that is wrong. If your product usage data does not match your CRM, fix the data layer first.
No closed loop on outcomes. If you never measure whether the save play worked, the model never gets smarter and the team stops trusting it. Track every intervention and feed outcomes back into retraining.
Ignoring the explainability requirement. Marketing leaders, CSMs, and finance teams will not act on a black box. Invest in SHAP-based explainability so the model can tell you why this specific account is at risk.
Activating the score in only one channel. If the score only triggers an email sequence, you are wasting 80 percent of its value. The same score should suppress acquisition retargeting, alert CSMs, surface on dashboards, and feed lifecycle automation.
Letting the model decay. Customer behavior, your product, and your market all shift. Retrain quarterly at minimum. Models that get stale produce confidently bad predictions, which is worse than no model at all.
How MarqOps unifies prediction and activation
The biggest reason churn prediction projects fail is not the model. It is the operational chasm between the prediction and the action. Scores get exported to a CSV that nobody opens, or they live in a data warehouse that marketing automation cannot read, or the CSM team gets alerts but the ads team does not, and the customer keeps seeing your prospecting campaigns while quietly canceling.
MarqOps closes that gap by unifying the data, the model, the activation, and the reporting in a single platform. One unified dashboard replaces the seven plus tools most teams duct-tape together to make this work today. The platform’s Brand Intelligence DNA keeps every save play, lifecycle email, and ad creative on-brand from the first touch, which matters because the worst possible retention email is the one that does not sound like the company the customer signed up with.
Marketing teams using AI marketing analytics and marketing intelligence platforms like MarqOps shorten the time from prediction to intervention from days down to minutes, while producing brand-perfect creative six times faster than legacy stacks.

The four-layer churn prediction loop: ingest, model, score, activate
Frequently asked questions
How accurate is AI customer churn prediction?
Well-built models reach AUC scores between 0.80 and 0.92, depending on data quality and the precision of the churn definition. That translates into correctly identifying roughly 70 to 85 percent of customers who actually go on to churn, with a manageable false positive rate. Accuracy is more sensitive to feature engineering and data hygiene than to the choice of algorithm.
How much data do I need to build a churn prediction model?
A useful baseline model can be trained on around 200 churn events and 1,000 active customers, but accuracy and stability improve significantly once you have 12 months of history with several thousand customers and a mix of churned and retained outcomes. If your dataset is small, start with logistic regression and graduate to ensemble models as your data grows.
Is churn prediction only for SaaS companies?
No. Subscription consumer brands, retail loyalty programs, financial services, telecom, media, and B2B services all benefit. Any business with repeat purchase or subscription revenue can model churn. Retail brands using predictive churn analytics report up to 2.9x revenue lift compared to reactive approaches.
How is churn prediction different from lead scoring?
Lead scoring predicts the likelihood that a prospect will convert. Churn prediction predicts the likelihood that an existing customer will leave. The math and feature engineering approach are similar, but the data sources, the time horizons, and the activation playbooks are very different. See the companion guide on AI lead scoring for the acquisition-side counterpart.
How often should I retrain the churn model?
At minimum quarterly. Many teams retrain monthly when product or pricing changes are frequent. Always retrain after a major release, a pricing change, or a meaningful shift in your customer mix. Set up automated monitoring so the team gets alerted when model accuracy drifts beyond a defined threshold.
What is the ROI of churn prediction?
A 5 percent reduction in churn can lift profits 25 to 95 percent, depending on customer lifetime value. Most teams see payback within one to two quarters once the model is in production and the save plays are running. The highest-ROI quick win is usually involuntary churn rescue through smart dunning, which can recover 50 to 80 percent of failed payments without any product change.
Can churn prediction work without a data science team?
Yes. Modern marketing operations platforms expose pre-built churn models, no-code feature engineering, and direct activation into CRM and marketing automation. The accessibility bar dropped significantly in 2025 and 2026. A marketing ops manager with a strong analyst partner can stand up a credible system in weeks, not quarters.
Next steps
If you are starting from zero, the highest-leverage move is to consolidate your data layer first and pick a single definition of churn second. Models come third. If you already have a churn score sitting in a warehouse but nobody acts on it, the gap to close is activation. Wire the score into your marketing automation, your CRM workflows, your ad suppression lists, and your CSM alerts, and then track every intervention so the next model is sharper than the last.
Either way, the teams winning at retention in 2026 are the ones who treat churn prediction as a marketing problem, not a data science project. The math is the easy part. The hard part is doing something useful with the answer fast enough to matter.
If you are also rebuilding the upstream stack, the same data foundation that powers churn prediction also feeds B2B marketing automation, marketing mix modeling, and multi-touch attribution. Build it once, use it everywhere.